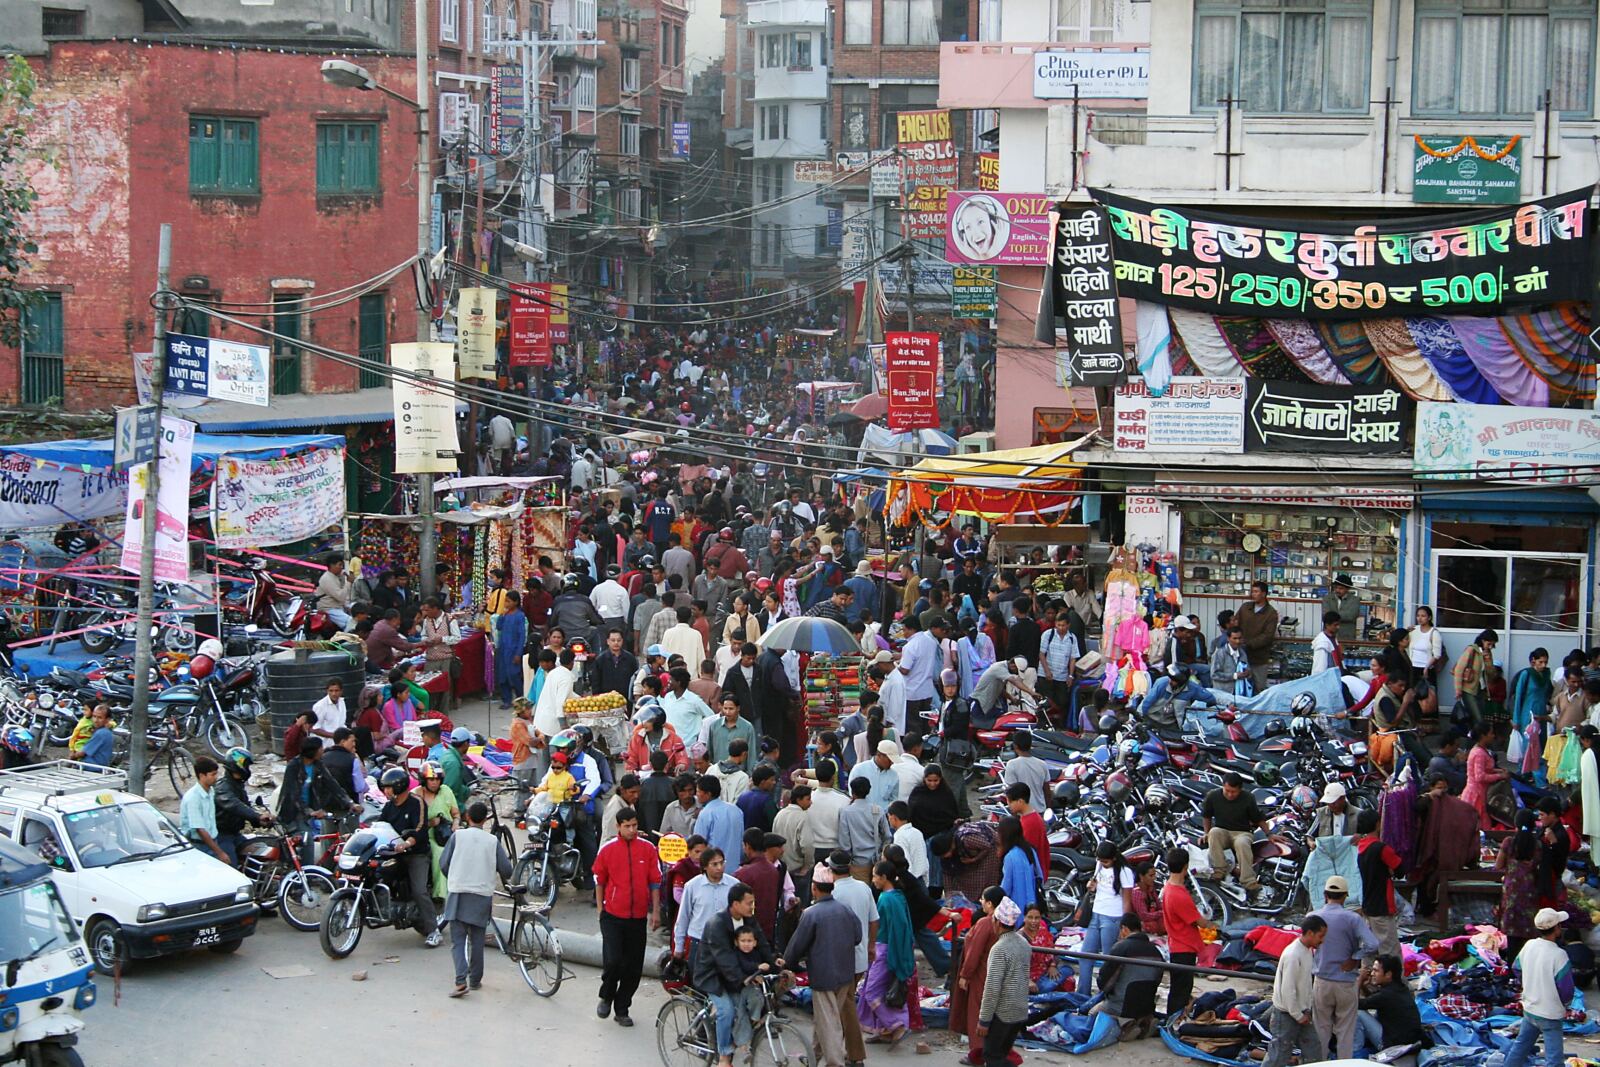
Kathmandu does not need London or Dubai prices to feel expensive. For a household earning and spending in Nepali rupees, the more important question is how much of its income disappears into rent, food, education, transport, healthcare and the everyday costs of living in the capital.
That distinction—between price and affordability—explains much of Kathmandu’s economic frustration. A meal, apartment or taxi ride may look inexpensive to a visitor converting dollars, pounds or dirhams. The same purchase can absorb a meaningful share of a locally earned salary.
Recent inflation data complicate the story further. Nepal Rastra Bank reported annual-average national consumer inflation of 3.08 percent in fiscal year 2025/26, but the first month of 2026/27 showed national inflation at 5.96 percent, with food and beverage inflation at 6.77 percent. Those figures measure changes in prices; they do not tell us whether the starting price was affordable for a particular household.
That is why Kathmandu can feel expensive even during periods when headline inflation is not exceptionally high.
Affordability is the real question
Imagine two cities where an ordinary household spends the same percentage of income on essentials. One may have much higher prices in absolute terms, but both households can experience similar financial pressure.
Kathmandu’s problem is therefore poorly captured by international “cheapest city” rankings. Those rankings often answer a traveller’s question: how many dollars does something cost? Residents face another question: how many hours or days of local work does it take to pay for it?
Nepal Digest’s recent household model, What Does It Cost to Live a Middle-Class Life in Nepal?, illustrated the difference. A four-person Kathmandu Valley household paying rent and private-school costs could plausibly require well above NPR 100,000 a month under the assumptions used in that model. It was not an official national benchmark; it showed how quickly ordinary urban expenses accumulate.
The salary-to-cost equation
The affordability problem becomes clearer mathematically. Define housing burden as monthly rent divided by monthly net income, multiplied by 100.
For a consistent cross-city comparison, Nepal Digest used Numbeo’s September–October 2026 crowdsourced city dataset rather than mixing unrelated salary and rent sources. It reports Kathmandu’s average monthly net salary at about NPR 40,273. A one-bedroom apartment averages about NPR 15,633 outside the centre and NPR 33,917 in the centre.
Outside centre: NPR 15,633 divided by NPR 40,273 gives about 38.8 percent of average net salary.
City centre: NPR 33,917 divided by NPR 40,273 gives about 84.2 percent.
So rent for a modest outside-centre apartment consumes nearly two-fifths of the reported average salary before food, electricity, transport, healthcare or savings. A typical central one-bedroom consumes more than four-fifths.
These are not official wage statistics. Numbeo is crowdsourced; Kathmandu’s property dataset reported 24 contributors and 128 entries during the previous 12 months. Its advantage here is consistency: the same definitions can be applied across cities.
Kathmandu versus Dubai and Bangkok
Dubai’s reported average net salary is about AED 12,653 and an outside-centre one-bedroom about AED 5,560, giving a rent-to-income ratio of approximately 43.9 percent. Bangkok’s reported average net salary is about THB 20,683 and comparable rent about THB 11,650, producing approximately 56.3 percent.
| City | Avg. monthly net salary | 1-bedroom rent outside centre | Rent as % of salary | Property price-to-income ratio |
|---|---|---|---|---|
| Kathmandu | NPR 40,273 | NPR 15,633 | 38.8% | 34.5× |
| Dubai | AED 12,653 | AED 5,560 | 43.9% | 8.3× |
| Bangkok | THB 20,683 | THB 11,650 | 56.3% | 36.5× |
This does not mean Kathmandu is more expensive overall than Dubai. Dubai’s absolute rents are vastly higher. It shows why converting prices into dollars is insufficient: local income determines the burden.
The ownership comparison is more striking. Numbeo’s price-to-income index is about 34.5 in Kathmandu, compared with roughly 8.3 in Dubai and 36.5 in Bangkok. On this measure, purchasing urban property relative to reported local income is dramatically harder in Kathmandu than Dubai and roughly comparable with Bangkok.
How many average salaries does a family budget require?
Nepal Digest’s earlier illustrative four-person Kathmandu model estimated recurring monthly expenses of roughly NPR 101,000–167,000 before savings. Compared with the NPR 40,273 reported individual net salary, the lower end equals about 2.51 average salaries; the upper end about 4.15 average salaries.
That does not mean every Kathmandu household needs four earners. The model includes rent, two children and private-school assumptions; real households may own homes, use public schools, receive remittances or combine salaries and business income. The calculation shows why an apparently respectable individual salary can still feel inadequate for a particular urban family standard.
Housing ownership changes the equation sharply. Removing NPR 25,000–35,000 of monthly rent cuts annual cash requirements by NPR 300,000–420,000. An inherited debt-free home therefore functions economically like a substantial addition to disposable income.
| Kathmandu affordability measure | Amount | What the arithmetic means |
|---|---|---|
| Reported average individual net salary | NPR 40,273/month | Baseline used for the salary comparisons |
| Illustrative family budget — lower end | NPR 101,000/month | 2.51× one reported average salary |
| Illustrative family budget — upper end | NPR 167,000/month | 4.15× one reported average salary |
| Illustrative 10% savings target | NPR 112,000–186,000/month | Resources required after adding a savings margin |
| Rent avoided by owning a home | NPR 25,000–35,000/month | NPR 300,000–420,000 less cash expenditure per year |
Housing creates two Kathmandus
The biggest divide is often not salary but housing ownership.
A family living in an inherited, debt-free Kathmandu home has a fundamentally different cost structure from an otherwise similar family paying market rent. The homeowner may have lower monthly cash income yet more disposable resources after housing.
This makes Kathmandu’s class structure unusually difficult to read from salary alone. Land and housing wealth accumulated by earlier generations can subsidise the present living standards of some households. New arrivals, young couples and migrants from other districts often face the opposite reality: they must purchase access to the city every month through rent.
Rent is also not a uniform Kathmandu price. Location, road access, parking, water supply, building age, neighbourhood reputation and proximity to schools or workplaces can change it dramatically. As jobs and services concentrate in the Valley, demand for conveniently located housing increases even when household incomes do not rise at the same pace.
Kathmandu pays for Nepal’s geography
The Valley consumes enormous quantities of goods that arrive from elsewhere. Food, fuel, medicine, construction materials, appliances and consumer products must move through Nepal’s transport system before reaching urban shelves.
The World Bank estimates that the Nagdhunga–Naubise–Mugling corridor alone carries roughly 60–70 percent of goods entering Kathmandu, including food, fuel, construction materials and medicines. That concentration exposes the capital to transport delays, road conditions and logistics costs.
Nepal’s geography makes moving goods expensive. Mountainous terrain raises infrastructure costs, while congestion and unreliable travel times add another layer once trucks approach the Valley. A product’s Kathmandu price therefore reflects more than what it cost at a farm or factory.
An import-dependent consumer economy
Nepal also buys a large share of what its consumers use from abroad. World Bank WITS data show consumer goods represented about 39 percent of Nepal’s merchandise imports in 2022, worth roughly US$5.36 billion. India supplied by far the largest share, with China the second-largest major source.
Imports are not inherently a problem. Countries import products that others can produce more efficiently, and Nepal benefits from access to medicines, electronics, machinery, vehicles and consumer goods that would be costly or impossible to manufacture domestically at scale.
But import dependence affects urban prices through freight, customs duties, VAT, distribution margins and exchange-rate exposure. When the rupee weakens against the currencies in which imports are priced, the local cost can rise even without a change in the foreign producer’s price.
Nepal’s fiscal structure reinforces this relationship. Historically, import taxes and VAT collected at the border have been important sources of government revenue. This makes the border not merely an entry point for goods but part of the tax system.
Vehicles show the tax effect clearly
Few products demonstrate the gap between foreign factory price and Nepali retail price as clearly as vehicles.
A World Bank analysis published in 2025 estimated that an average 1,000cc internal-combustion light-duty vehicle costing NPR 30.6 lakh in Nepal included about NPR 21.8 lakh in duties and taxes—roughly 71 percent of its final cost under the assumptions used in the analysis. Electric vehicles faced substantially lower taxation.
Those taxes reflect policy choices: Nepal uses high duties partly to raise revenue, manage imports and influence transport choices. But from the household’s perspective, the consequence is straightforward. Private mobility is expensive.
The purchase price is only the beginning. Fuel, insurance, servicing, tyres, parking and depreciation turn vehicle ownership into a recurring household expense. Public transport remains much cheaper, but unreliable routes, overcrowding and long travel times can push middle-income households toward motorcycles, scooters or cars despite the cost.
Education has become a household investment
Education illustrates another feature of Kathmandu’s affordability problem: families frequently purchase privately what the state also provides publicly.
Private schools differ enormously in price and quality, so there is no meaningful single “Kathmandu school fee.” Yet for households choosing private education, tuition is only one component. Transport, uniforms, books, activities, admission charges and annual fees can become a major recurring expense.
Parents may accept those costs because they view education as an investment in their children’s future earning power. That makes education spending unusually resistant to household budget cuts.
The result is a form of voluntary but socially powerful inflation in expectations. As more families compete for particular schools, neighbourhoods and educational experiences, the standard associated with a “comfortable” urban life becomes more expensive even when basic survival remains possible at much lower cost.
Healthcare has the same hidden structure
Healthcare creates similar pressure because expenditure is irregular.
A healthy household may spend little for several months and then encounter diagnostics, dental work, medicines, specialist consultations or hospital treatment. Looking only at average monthly spending therefore understates the financial risk.
Middle-income households often respond by maintaining savings or relying on family networks. When those buffers are absent, an unexpected medical event can turn an apparently manageable monthly budget into debt.
Food prices are experienced every day
Housing may be the largest fixed expense, but food is the price signal households encounter most frequently.
Nepal Rastra Bank’s first-month data for fiscal year 2026/27 showed food and beverage inflation running above the overall national inflation rate. Individual categories can move very differently, and households do not buy the statistical basket in identical proportions.
A family that spends a large share of income on groceries feels food inflation more intensely than a wealthier household for which food is a smaller share of expenditure. This is why the same inflation rate can produce very different lived experiences.
Remittances complicate Kathmandu’s price economy
Nepal’s households do not live only on domestic salaries. Remittances are now deeply embedded in household finances. Nepal Rastra Bank reported workers’ remittances equivalent to 35.8 percent of GDP in fiscal year 2025/26.
That income supports consumption, education, housing and savings. It can also allow some households to spend at levels that local wages alone would not sustain.
This does not mean remittances simply “cause high prices.” Housing supply, imports, taxation, infrastructure and consumer preferences matter independently. But remittance income changes purchasing power for a large section of society and helps explain why local salary statistics alone cannot describe Kathmandu’s consumer economy.
The relationship also connects directly to migration. In The Generation That Left, Nepal Digest examined how foreign employment has become part of the economic architecture of Nepali households. Kathmandu is one of the places where the money earned abroad is converted into education, property, services and consumption.
Why strong national numbers can coexist with household frustration
Nepal can simultaneously have strong foreign-exchange reserves, large remittance inflows and households that feel financially squeezed.
There is no contradiction. Macroeconomic stability and household affordability measure different things.
Foreign-exchange reserves help a country pay for imports and withstand external shocks. A balance-of-payments surplus strengthens external stability. Neither tells us how much rent a young Kathmandu worker pays or what proportion of income a family spends on school fees.
As Nepal Digest explored in Nepal Has More Money Than Ever. So Why Doesn’t the Economy Feel Rich?, healthy external accounts do not automatically translate into high productivity, strong wages or household prosperity.
The cost of time belongs in the calculation
Kathmandu also imposes costs that conventional price indices struggle to capture.
Congestion consumes time. A cheaper home farther from work can produce a longer commute. Poor road conditions increase vehicle maintenance. Unreliable water can require household storage or private supply. Pollution creates health and quality-of-life costs.
These are not always visible on a supermarket receipt, but they influence what it costs to function in the city.
For professionals, time lost in traffic is an economic cost even if no cash changes hands. For businesses, unreliable logistics and congestion can become operating costs that eventually feed into prices.
Kathmandu is expensive differently for different people
There is no single Kathmandu cost of living.
For an established homeowner with family property, public-school access and no vehicle loan, the city may remain relatively affordable. For a young renting family paying private-school fees and financing transport, the same city can be financially demanding. For a migrant worker supporting relatives outside the Valley, another set of obligations applies.
This is why sweeping claims that Kathmandu is either “cheap” or “expensive” are analytically weak. Both can be true depending on whose income and whose expenses are being measured.
The real problem is the gap
Kathmandu’s affordability problem is ultimately a gap between the economy residents participate in and the standard of urban life many are trying to finance.
The city concentrates opportunity: jobs, universities, hospitals, government, businesses, entertainment and professional networks. That concentration attracts people and money. But housing supply, infrastructure, public transport and high-quality public services have not always expanded smoothly with demand.
Households fill the gaps privately. They rent closer to work. They buy motorcycles because buses are inconvenient. They pay school fees. They purchase healthcare. They install water tanks, internet connections and backup systems. Each decision is rational on its own. Together they create an expensive urban household.
The answer is therefore not simply lower prices. Sustainable affordability requires higher productivity and incomes alongside better housing supply, transport, infrastructure and public services.
Kathmandu does not feel expensive because every item carries a globally extraordinary price tag. It feels expensive because too many ordinary costs compete for incomes that remain limited.
For residents, that ratio—not the dollar price of coffee or rent—is the number that matters.
Data note: Inflation and remittance figures refer to Nepal Rastra Bank data for fiscal year 2025/26 and the first month of 2026/27. Import composition uses World Bank WITS data for 2022, the latest complete product-group dataset cited here. Vehicle-tax and Kathmandu freight-corridor figures draw on World Bank analysis. Household examples are explanatory and are not official cost-of-living benchmarks.